EComposer Page Analytics
Analyzing website performance is crucial to understand user behavior and improve website conversions. EComposer built-in Analytics help you track the performance of your web pages in real-time by analyzing five key metrics. Let’s explore how it woks in this article.
Notice: This function is on alpha version. If you see any wrong reports, contact us via livechat in-app or via [email protected] to get assistance.
How EComposer Page Analytics Work?
By collecting data on user behavior, including browsing patterns, purchase history, and demographics, we can provide merchants with actionable insights to help them improve their business. This data can be used to develop targeted marketing campaigns, optimize product offerings, and enhance the overall customer experience.
However, to use our app, merchants must agree to our policy for collecting and using this data. So enabling this function means you agree to our Privacy policy & Term of service. If you have any questions or concerns about our data collection practices, please don’t hesitate to contact us.
How to Enable & View Ecomposer Analytics
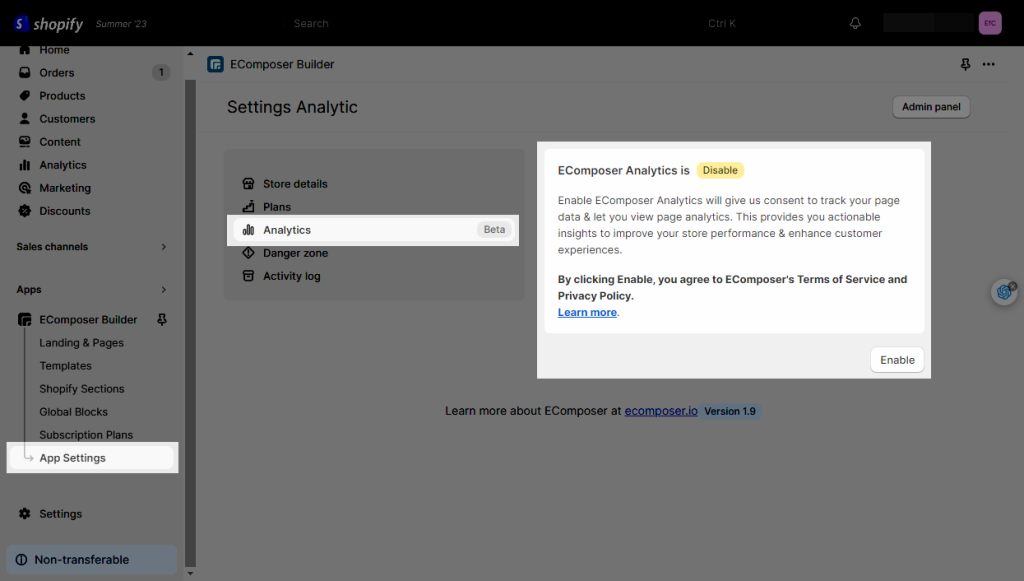
- From app dashboard, open “ App Settings”
- Open “Analytics” from settings, then click “Enable”
Note: This function is currently on alpha version, means we need time to test & make it work perfectly. If you want to use this now, chat with our support to enable it for your store.
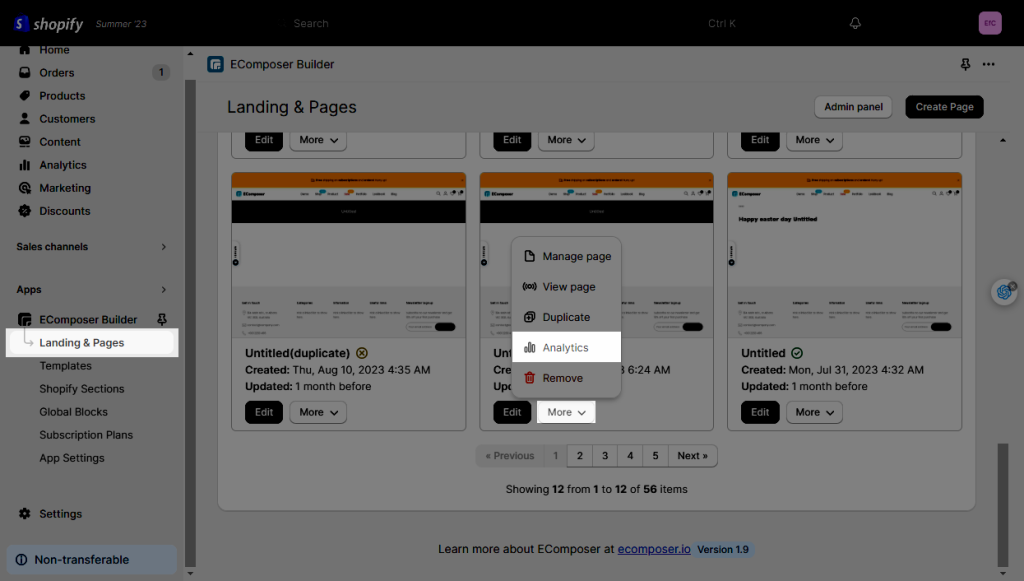
- View Analytics from any EComposer page
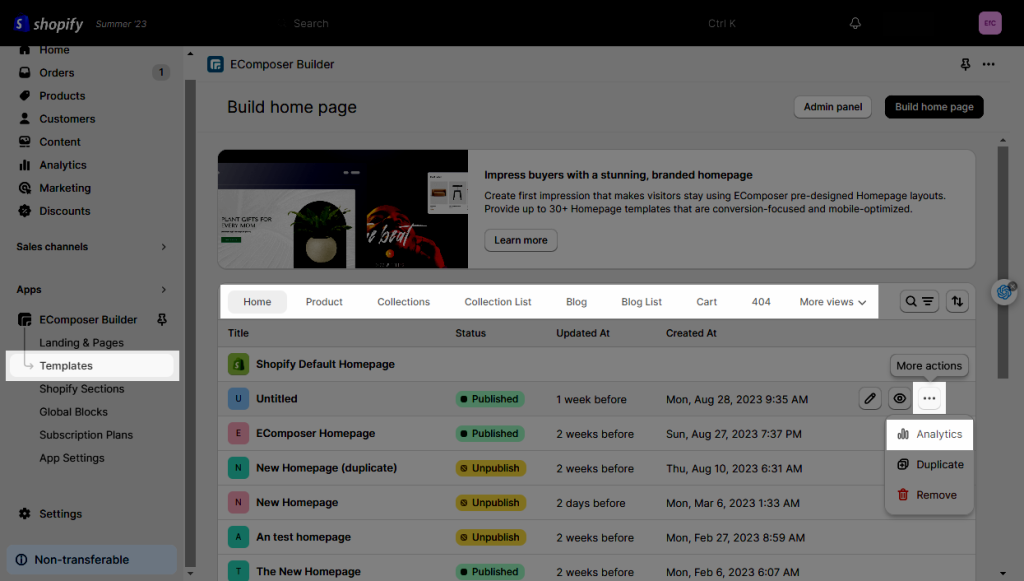
Now the app starts tracking your page performance. You can view all reported metrics of any EComposer page by clicking to “Analytics” button from any page.
For landing page:
For other pages:
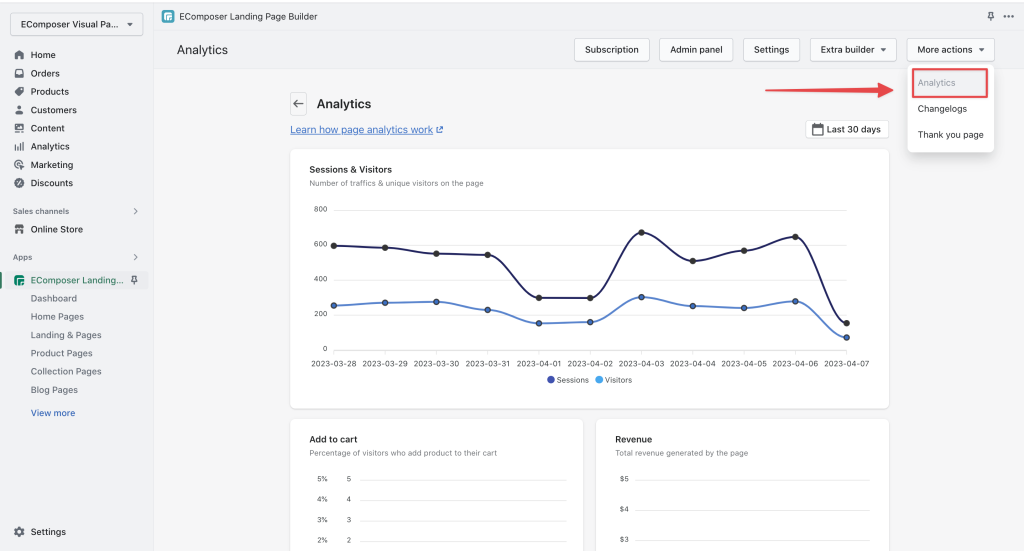
- View general analytics for all pages
From “More actions” > Go to “Analytics” you will see the general analytics for all pages in EComposer. Here show reports of Sessions, visitors, Add-to-cart and Page Revenue.
What Metrics are Reported?
EComposer’s Page Analytics feature reports on five key metrics: Sessions, Visitors, Add-to-Cart, Page Revenue, and Bounce Rate.
Sessions
Sessions refer to the total number of times a user has visited your web page within a set time period. This metric is an excellent way to track the overall performance of your page.
Visitors
Visitors refer to the number of unique users who have visited your web page within a set time period. This metric is useful for understanding how many people are visiting your site.
Add-to-Cart
Add-to-Cart refers to the number of times a user has added an item to their shopping cart. This metric is essential for eCommerce sites and can help you understand how many people are interested in your products.
Page Revenue

Page Revenue refers to the total revenue generated by a web page within a set time period. This metric is crucial for understanding the overall profitability of your website.
Bounce Rate
Bounce Rate refers to the percentage of users who leave your web page without taking any action. This metric can help you identify any issues with your page that may be causing users to leave.
Conversion rate
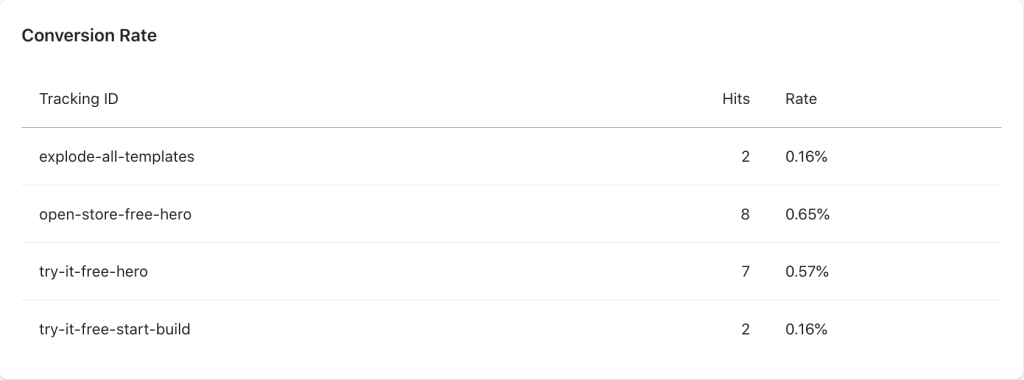
Conversion rate shows how well your CTA button can convert visitors into clicks. You can see how many clicks & rate of click/visitors for specific CTA buttons that have the tracking ID added from EComposer page editor.
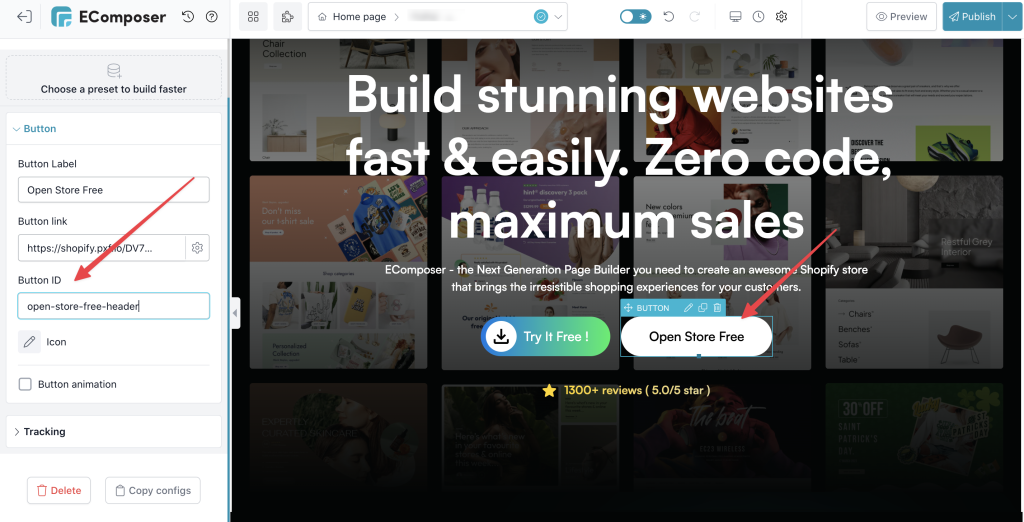
To track Conversion Rate of a button on your page, from EComposer editor, click on that button and enter the button ID here (Button ID is Tracking ID on Analytics page):
EComposer’s Page Analytics feature is an excellent tool for tracking the performance of your web pages. By analyzing key metrics like Sessions, Visitors, Add-to-Cart, Page Revenue, and Bounce Rate, you can gain valuable insights into user behavior and optimize your pages for better conversions. Whether you’re new to eCommerce or a seasoned pro, EComposer’s Page Analytics feature can help you take your website to the next level.




1 Comment
Midas
🎉 Wow! The new analytic features of EComposer are truly game-changing! 📊✨ Now, it’s easier than ever to track and understand user behavior and engagement on our pages. The detailed insights provided by these features allow us to make data-driven decisions, optimizing our site for maximum performance and user satisfaction. Kudos to the EComposer team for continually enhancing their platform to better serve their users! 🙌💯
Reply