A/B Testing
A/B Testing in EComposer allows you to compare different versions of your page to see which one performs better. Create multiple variations of a section, page, or layout and track real-time performance metrics like conversions, clicks, and engagement. With visual editing and built-in analytics, you can make data-driven decisions to optimize your store’s user experience and boost sales. No coding needed, just test, measure, and publish the winning version with confidence.
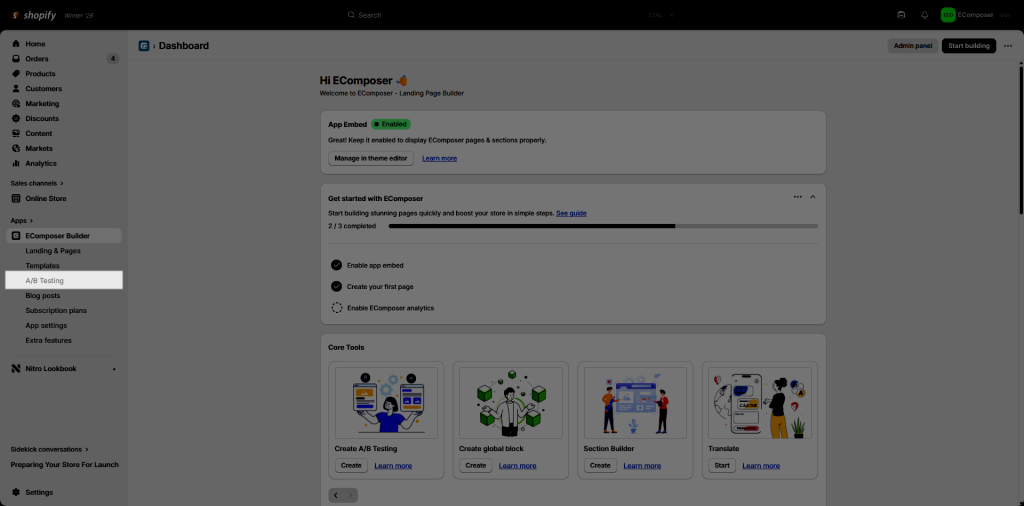
To open the A/B Testing feature in EComposer, please open the App dashboard -> A/B Testing.
1. Steps required before creating an A/B Test
You have to complete 3 steps before enabling the A/B testing features:
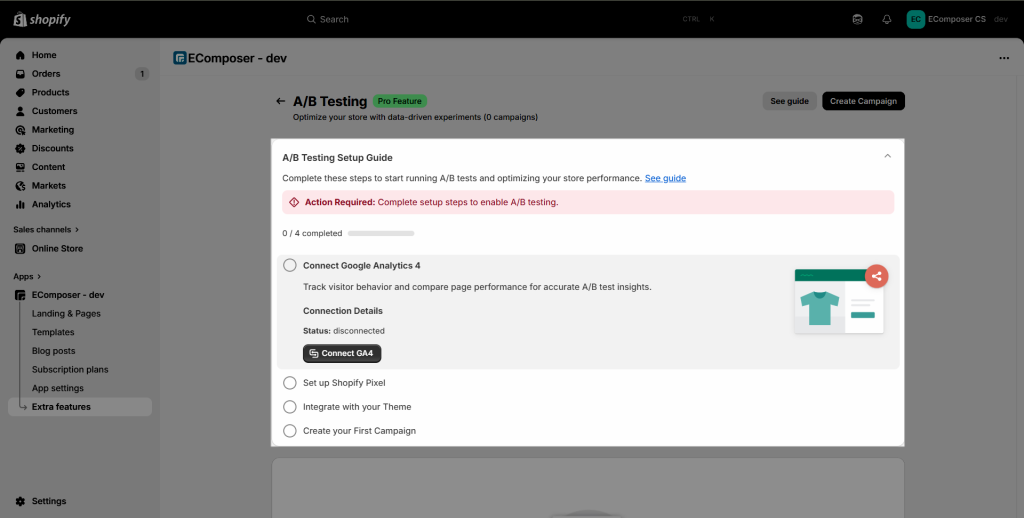
Step 1: Connect Google Analytics 4
To accurately track visitor behavior and performance differences between your page variations, you’ll need to connect Google Analytics 4. GA4 provides key insights like conversions, engagement time, and event tracking. Once connected, EComposer can pull data directly from GA4 so you can measure which version of your page drives better results.
You can follow the video guide below to connect Google Analytics 4 (GA4) to EComposer:
Step 2: Set up Shopify Pixel
The Shopify Pixel ensures that customer interactions (such as product views, add-to-cart events, and purchases) are recorded correctly. By enabling the Shopify Pixel, performance data from your A/B experiments is passed directly into your Shopify analytics. This allows you to evaluate results based on real store conversions, not just traffic metrics.
Set up Shopify pixel easily by following this video guide below:
Step 3: Integrate with your Theme
To run A/B tests live on your storefront, EComposer must be properly integrated with your active Shopify theme. This step ensures that your test variations display seamlessly to customers and that performance tracking works accurately.
Simply embed our app inside your theme to finish this step:
2. Create Campaign
To set up an A/B Test in EComposer, you will go through 5 key steps. Each step helps you define how your experiment should run, who will see it, and how data should be collected
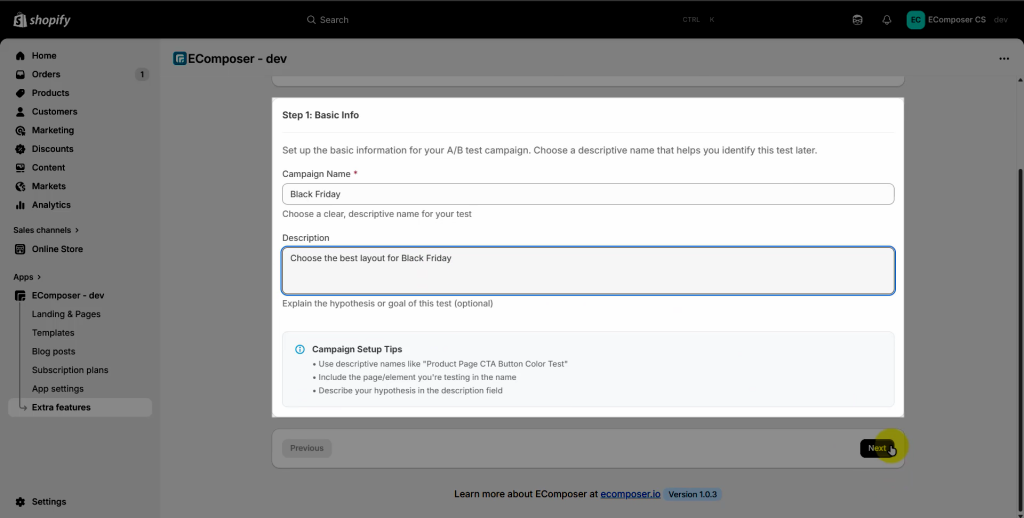
Step 1: Basic Info
Enter your Campaign Name and Description. This helps you manage and identify campaigns easily, especially when running multiple tests.
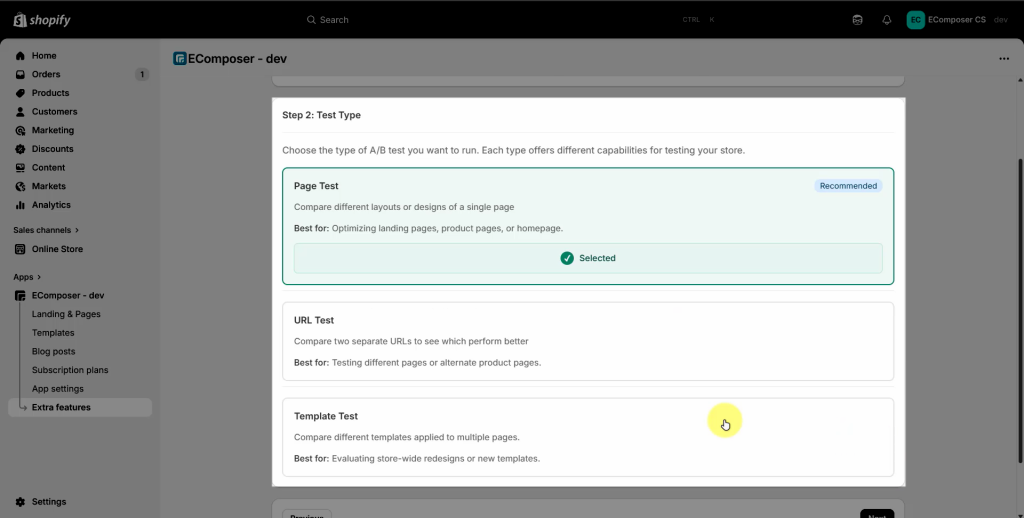
Step 2: Test type
You can choose between three types of tests:
- Page Test: Compare two or more versions of the same page. This is best for product pages, landing pages, blog posts, or any single-page experiment.
- URL Test: Test two completely different URLs to compare performance. This is ideal for seasonal landing pages, alternative sales funnels, or separate campaign pages.
- Template Test: Test EComposer templates that apply to multiple pages such as product, collection, or blog templates. This allows you to optimize the customer experience across your entire store, not just one page.
Step 3: Traffic & Variant
Define how visitor traffic is split between your Control version and Test version(s). You can adjust the percentage of traffic, create new variants, and set rules for how EComposer should direct visitors to each version.
- Visitor Behavior: determines how often a visitor sees a specific test version in EComposer
- One time only: Each visitor will see a randomly assigned version just once and keep seeing the same version on future visits.
- Every visit: The version shown can change each time the visitor returns to the page, allowing more variation in exposure.
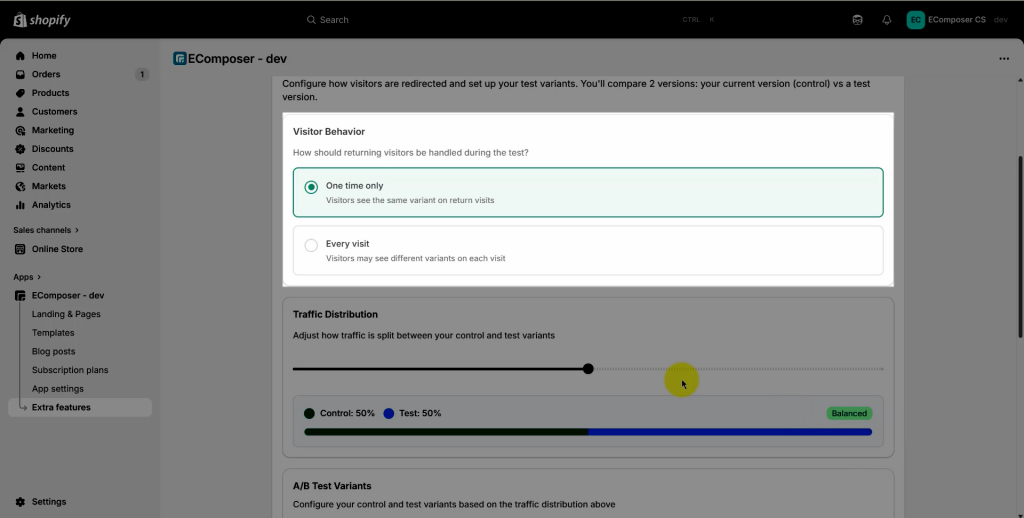
- Traffic Distribution: This option allow you to adjust how traffic is split between your control and test variants.
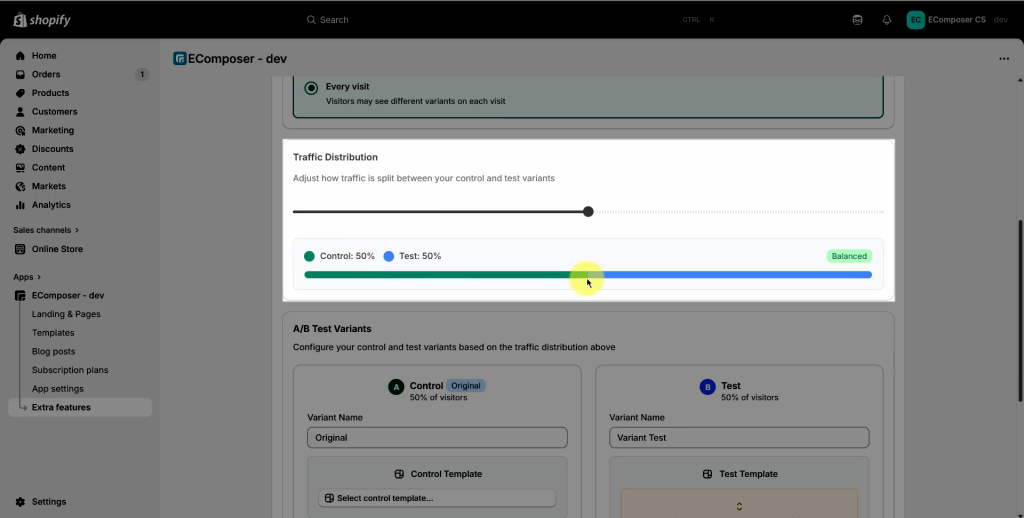
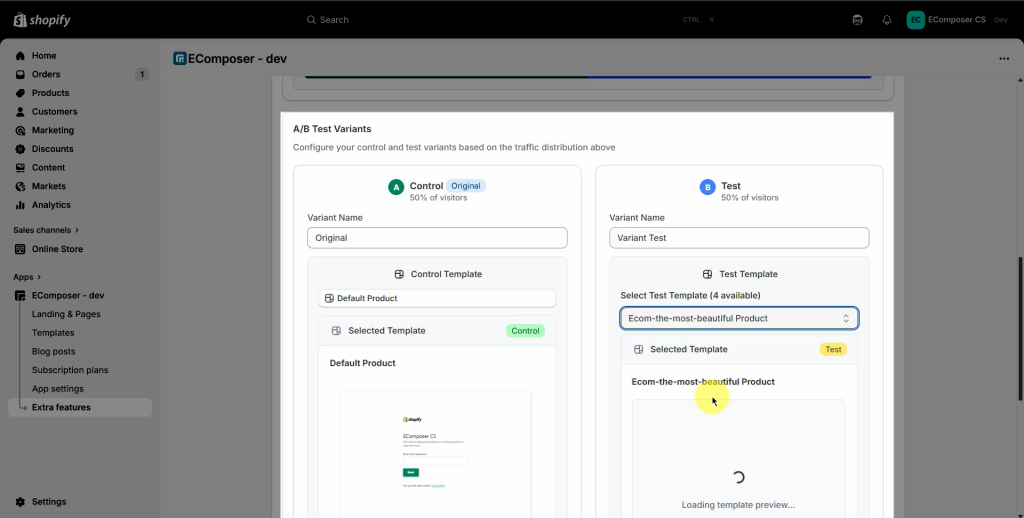
- A/B Test Variants: Configure your control and test variants based on the traffic distribution above.
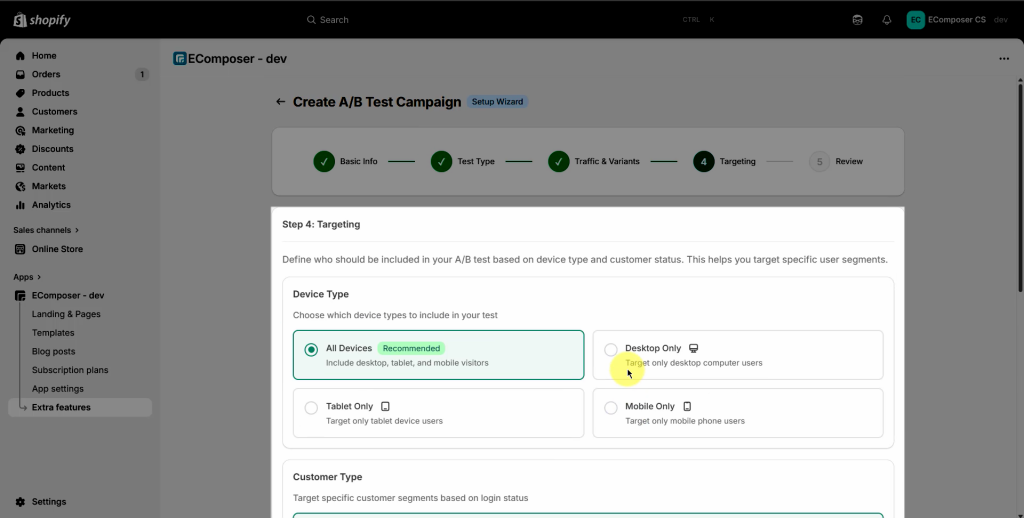
Step 4: Targeting
This step will help you define who should be included in your A/B test based on device type and customer status. This helps you target specific user segments.
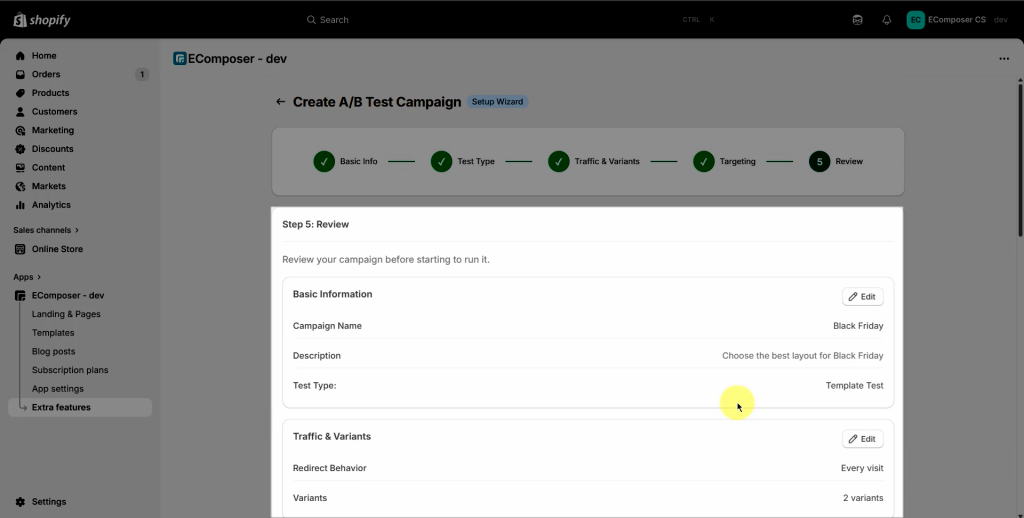
Step 5: Review
Before publishing, you’ll see a summary of all your configurations: Test type, variants, traffic split, targeting rules, and basic info. This step ensures everything is correct before the campaign goes live.
- You can check the video guide below for more details:
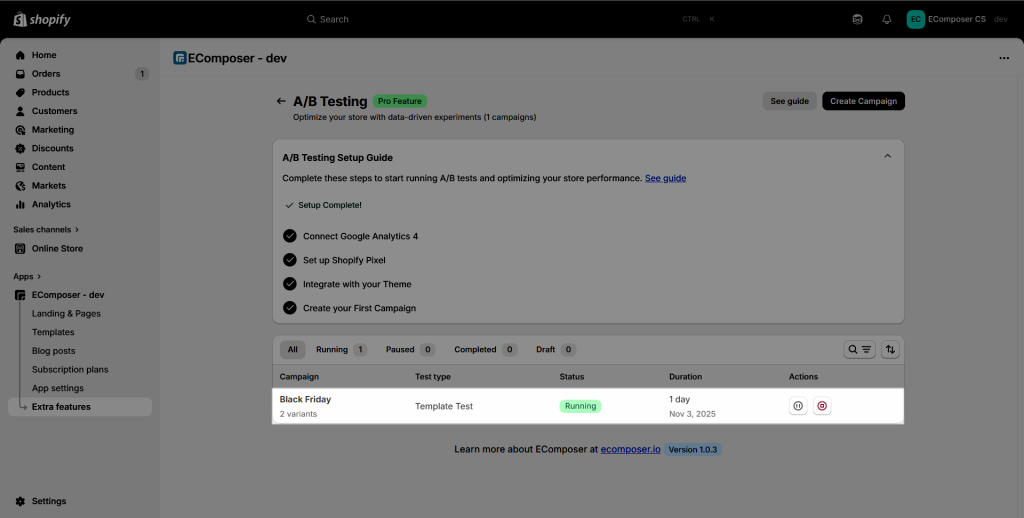
3. Result
You can click into each campaign to view the statistics:
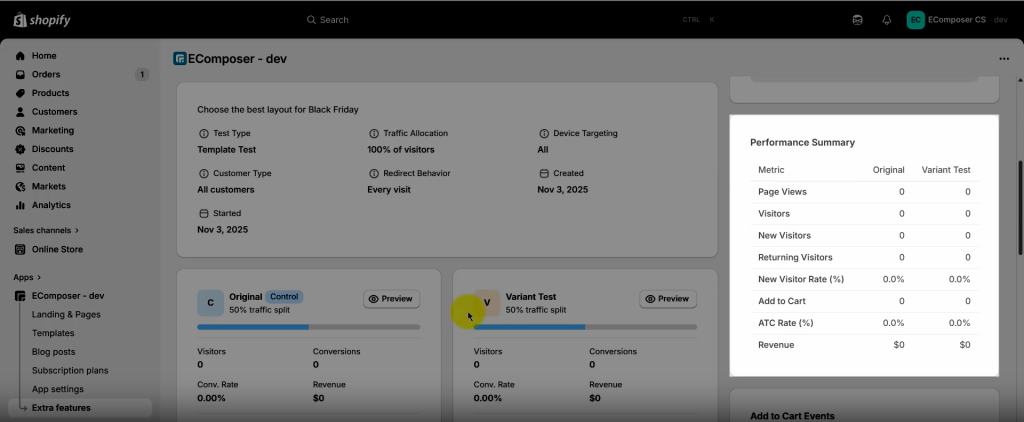
3.1 Test Information
- Test Type: Indicates whether the test compares Pages, URLs, or Templates.
- Traffic Allocation: The percentage of total visitors included in the test.
- Device Targeting: Specifies which devices (desktop, mobile, etc.) are included.
- Customer Type: Defines the audience (e.g., All customers, New visitors, etc.).
- Redirect Behavior: Shows whether visitors see the same version One time only or Every visit.
- Created / Started Date: Dates the test was created and began running.
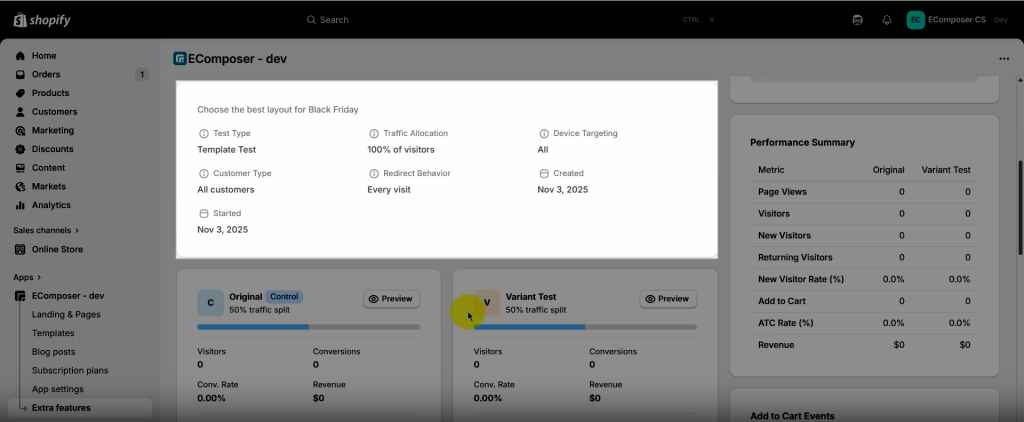
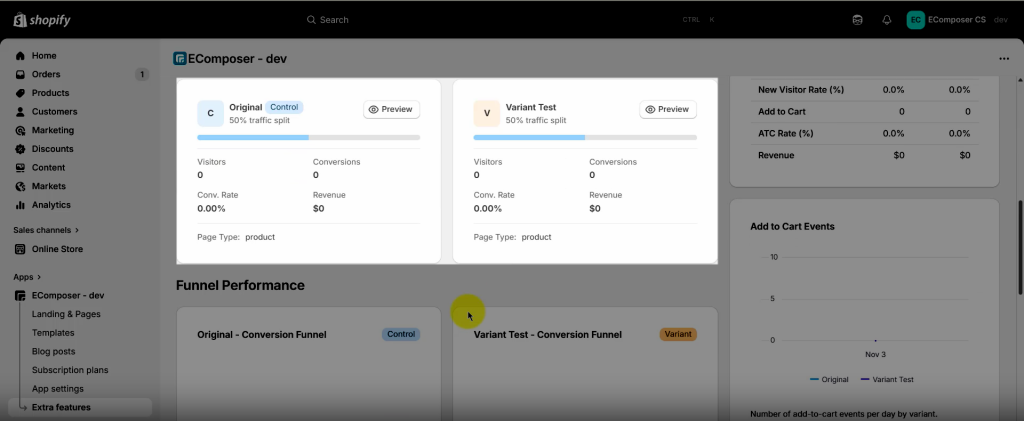
3.2 Test Variants
- Original (Control): The current live version used as the baseline.
- Variant Test: The new version being compared against the original.
- Traffic Split: The percentage of visitors assigned to each version (e.g., 50/50).
Each version includes:
- Visitors: Number of users who viewed that version.
- Conversions: Number of users who completed the desired goal.
- Conversion Rate: Percentage of visitors who converted.
- Revenue: Total revenue generated by that version.
- Page Type: The page category being tested (e.g., product, landing page).
3.3 Performance Summary
- Page Views: Total number of page views for each version.
- Visitors: Number of unique visitors.
- New Visitors: Users visiting for the first time.
- Returning Visitors: Users who have visited before.
- New Visitor Rate (%): The percentage of total visitors who are new.
- Add to Cart: Number of “Add to Cart” actions triggered.
- ATC Rate (%): Add to Cart actions divided by total visitors.
- Revenue: Total income generated from each version.
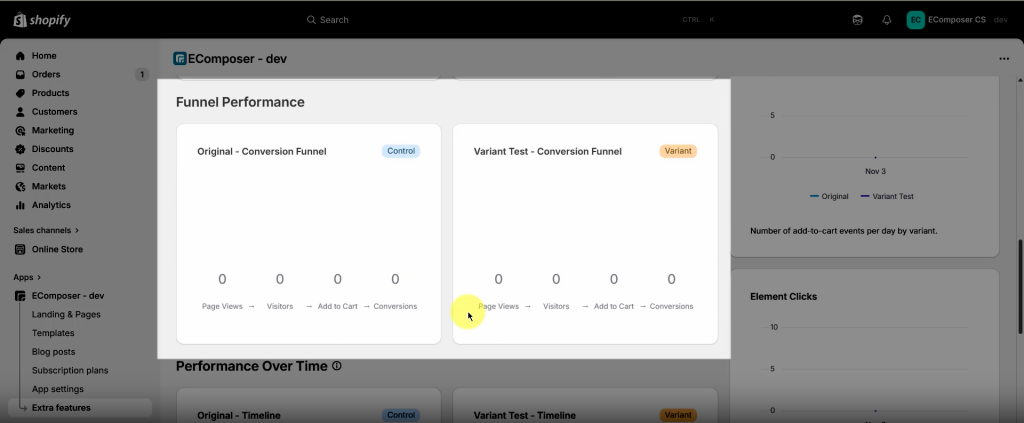
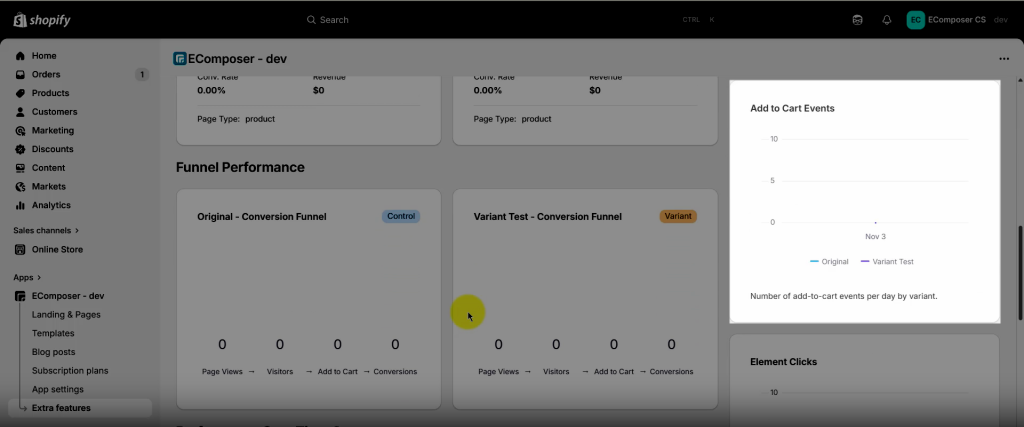
3.4 Funnel Performance
Shows how visitors progress through your conversion funnel for each version:
- Original – Conversion Funnel and Variant Test – Conversion Funnel:
Visualizes key steps like Page View → Add to Cart → Checkout → Purchase, helping you identify where users drop off and which version converts better at each stage.
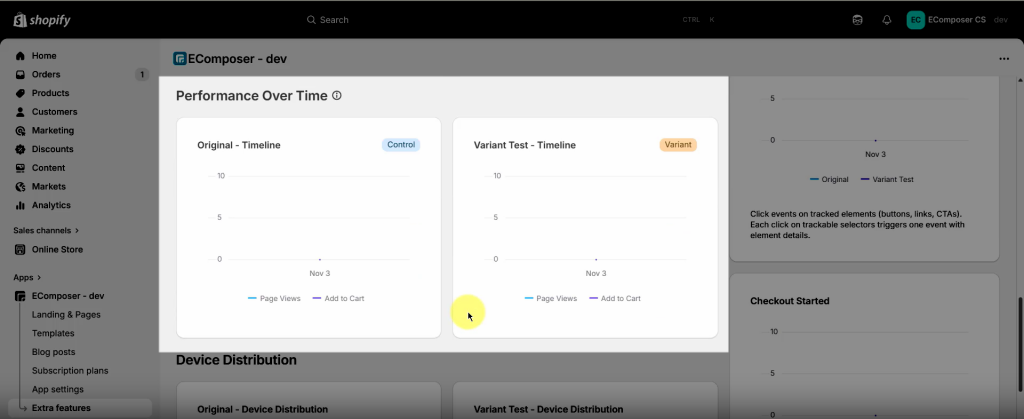
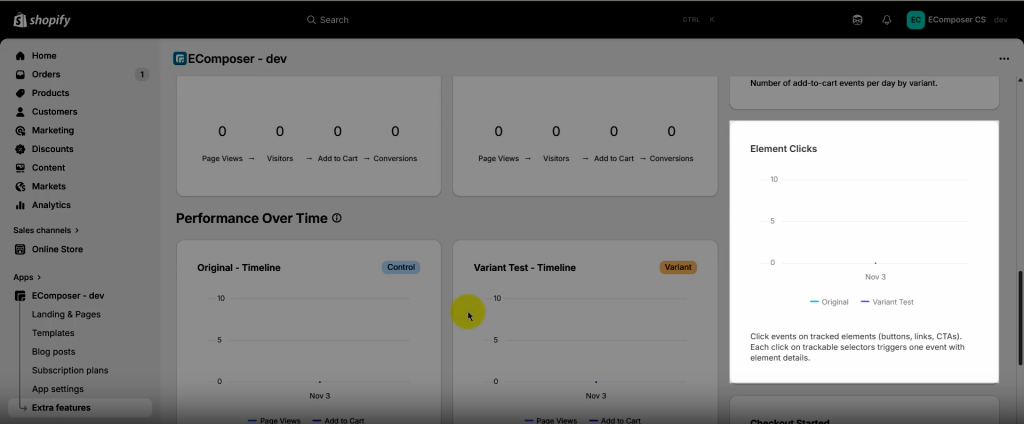
3.5 Performance Over Time
Tracks how results evolve throughout the test:
- Original – Timeline and Variant Test – Timeline:
Display daily or periodic trends in metrics like visitors, conversions, and revenue, allowing you to spot performance patterns or seasonal impacts.
3.6 Element Clicks
Shows which elements on the page (buttons, banners, images, etc.) users click most often, helping you understand engagement hotspots and user focus areas for both versions.
3.7 Add to Cart Events
Breaks down “Add to Cart” actions across both test versions, helping you gauge shopping intent and which layout or design drives stronger purchase behavior.
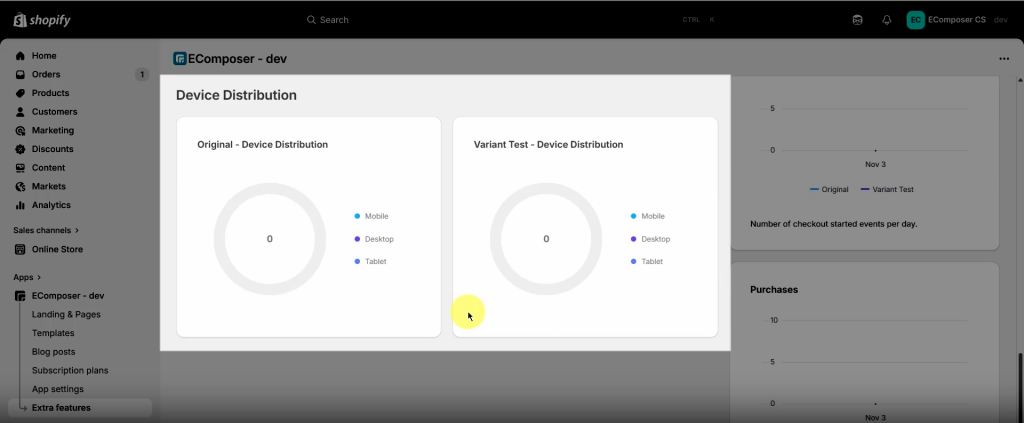
3.8 Device Distribution
Displays how traffic and conversions are distributed across devices:
- Original – Device Distribution and Variant Test – Device Distribution:
Helps you identify performance differences on desktop, tablet, and mobile devices.
3.9 Purchases
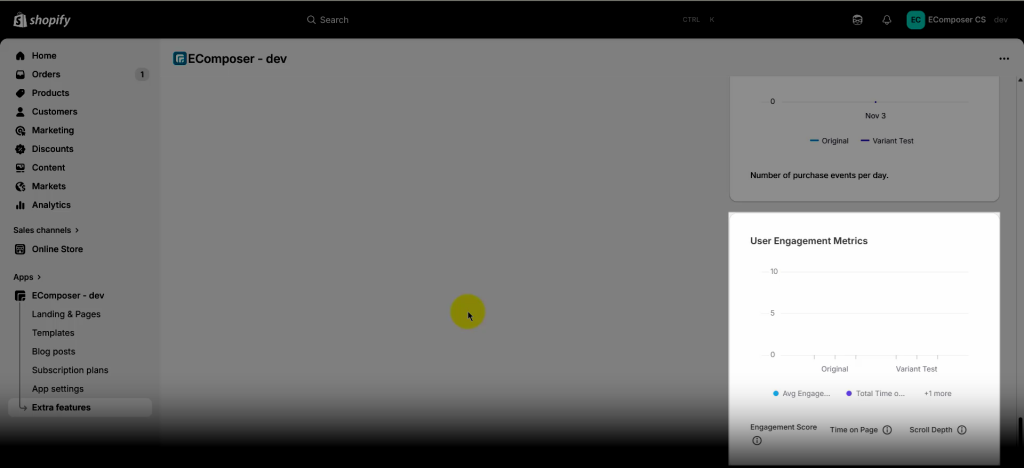
Compare the number of purchase events per day between Original and Variant Test
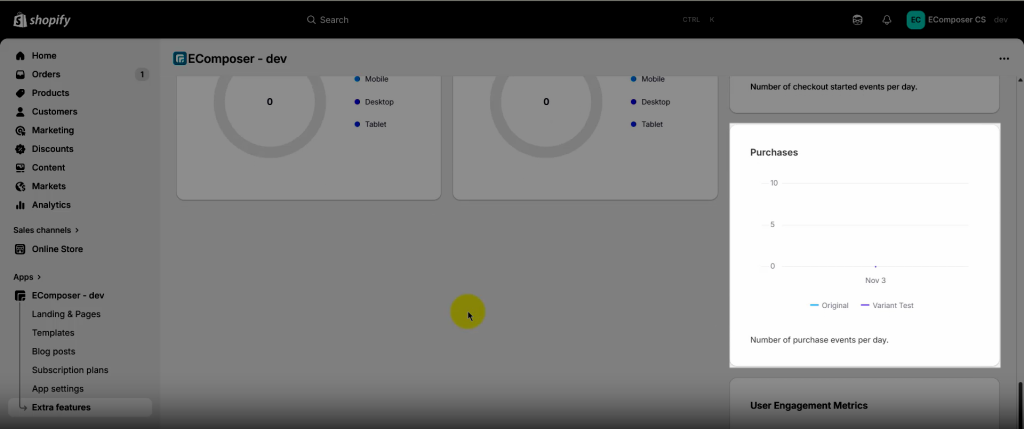
3.10 User Engagement Metrics