

EComposer Page Analytics
Analyzing website performance is crucial to understanding user behavior and improving website conversions. EComposer’s built-in Analytics help you track the performance of your web pages in real-time by analyzing five key metrics. Let’s explore how it works in this article.
How EComposer Page Analytics Work?
By collecting data on user behavior, including browsing patterns, purchase history, and demographics, we can provide merchants with actionable insights to help them improve their business. This data can be used to develop targeted marketing campaigns, optimize product offerings, and enhance the overall customer experience.
However, to use our app, merchants must agree to our policy for collecting and using this data. So enabling this function means you agree to our Privacy policy & Term of service. If you have any questions or concerns about our data collection practices, please don’t hesitate to contact us.
How to Enable & View Ecomposer Analytics
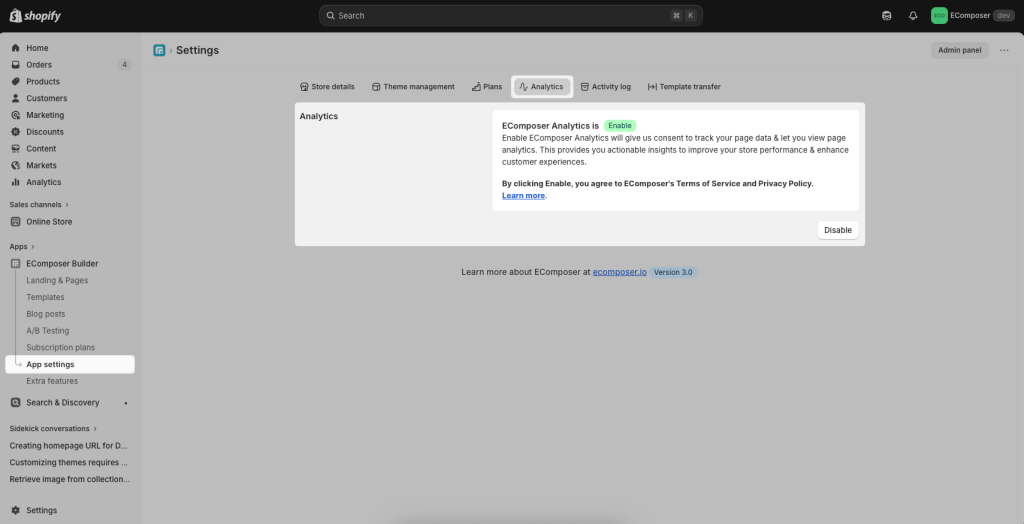
Go to App Settings > Analytics > Enable to start tracking the visitors engagement on your EComposer pages.
View analytics for specific pages
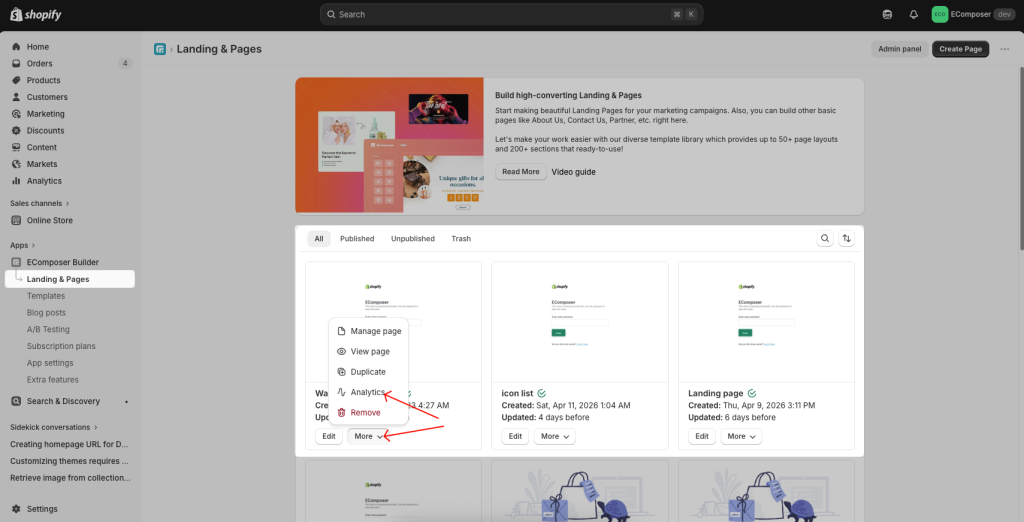
The app now starts tracking your page performance. You can view all reported metrics of any EComposer page by clicking on the “Analytics” button from any page.
For landing page:
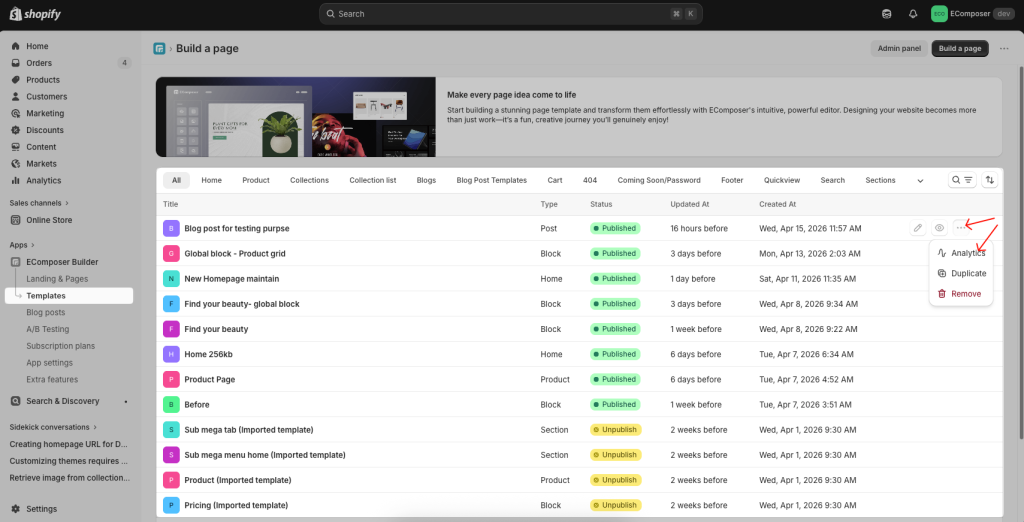
For other pages:
View general analytics for all pages
From the Analytics page of each Page/ Template, you can also open the general analytics for all pages in EComposer. Here are reports of Sessions, visitors, Add-to-cart, and Page Revenue of the store.
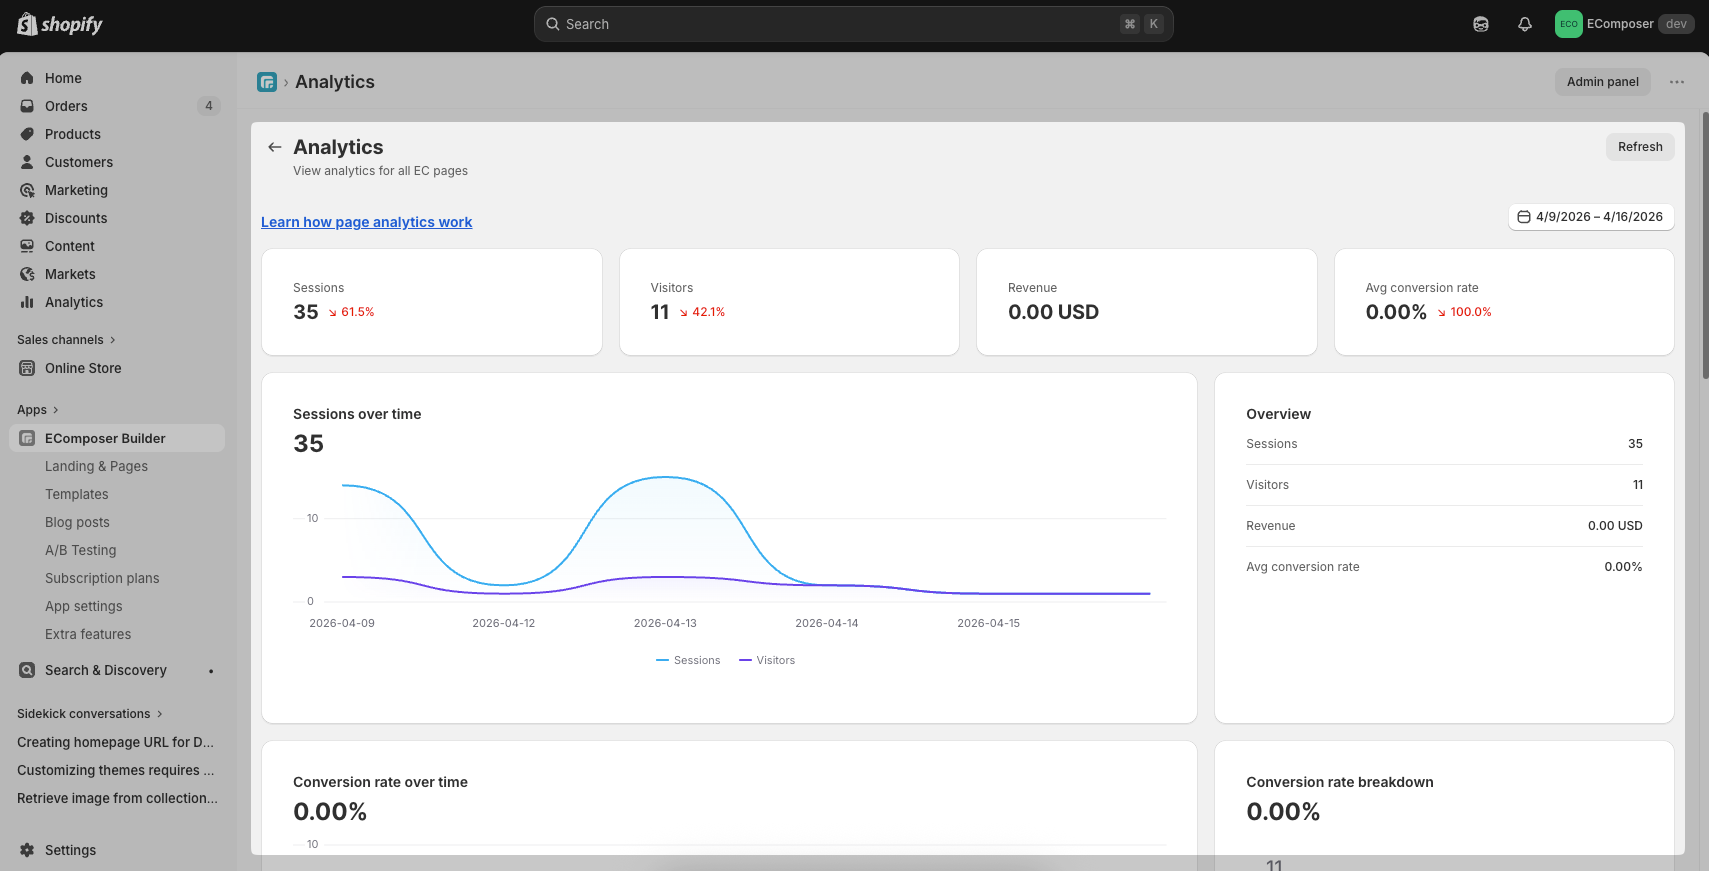
What Metrics are Reported?
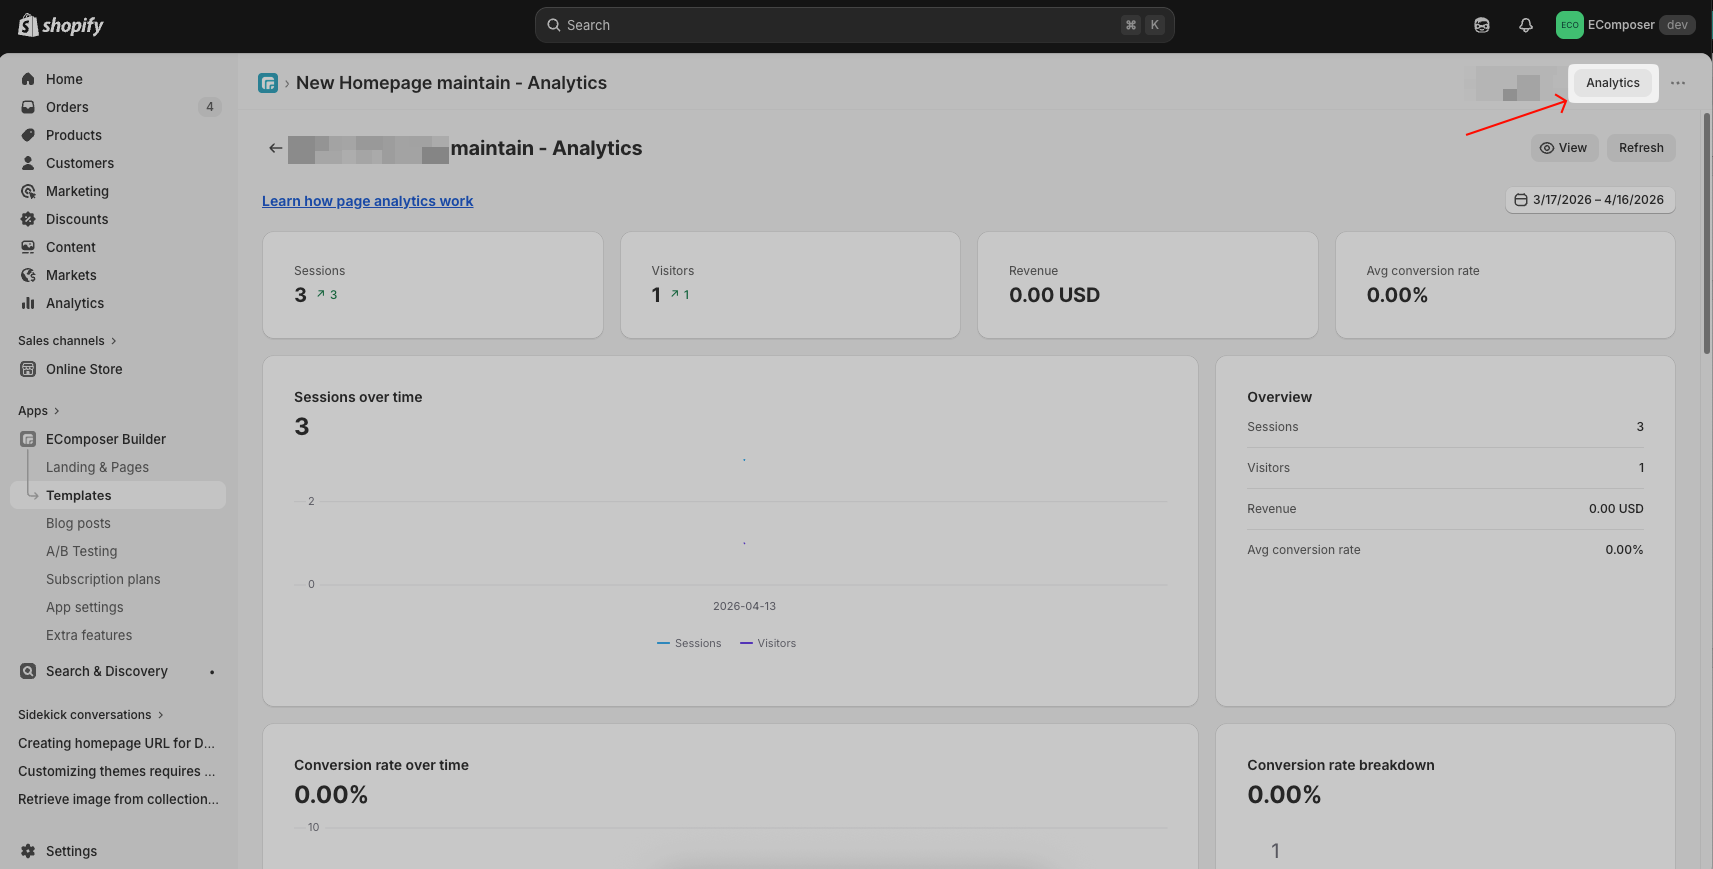
EComposer’s Page Analytics feature reports on five key metrics: Sessions, Visitors, Revenue, and Avg Conversion Rate.
- Sessions: Total number of visits to your page within the selected date range.
- Visitors: Number of unique users visiting your page.
- Revenue: Total revenue generated from the page.
- Avg conversion rate: Percentage of visitors who completed a conversion action.
You can adjust the date range to analyze performance over a specific period.
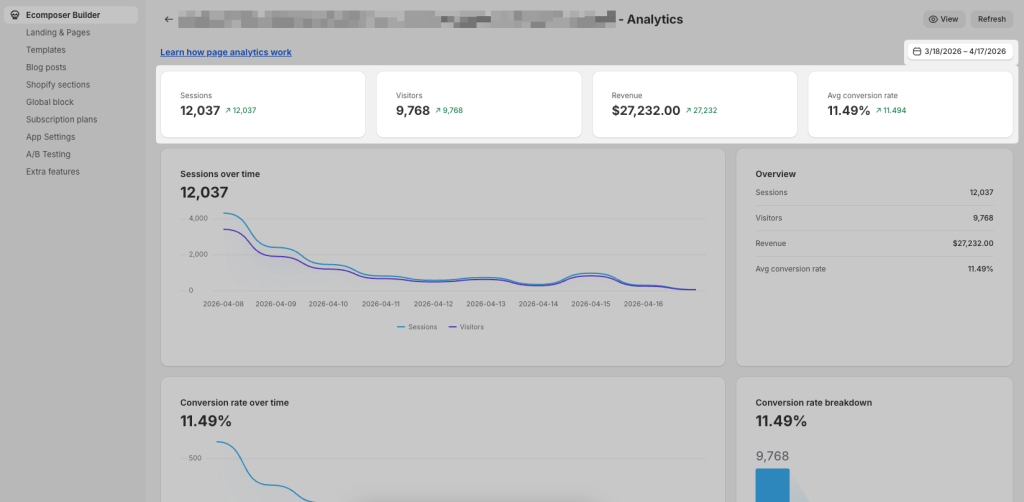
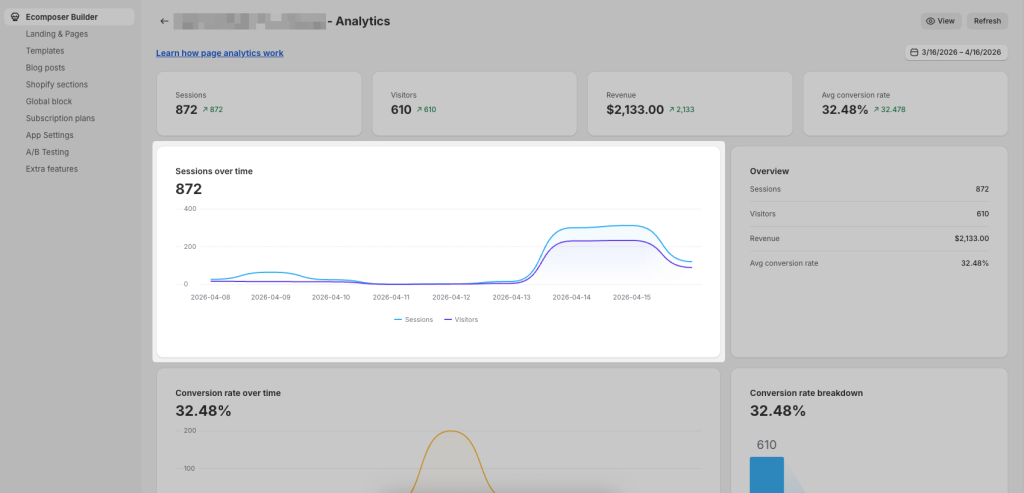
Sessions Over Time
This chart shows how traffic changes over time:
- Displays both Sessions and Visitors trends
- Helps identify traffic spikes or drops
- Useful for evaluating campaign performance or seasonal behavior
Conversion Rate Over Time
- Shows how your conversion rate evolves over time
- Includes actions such as Add to cart and overall conversion rate
- Helps identify when performance improves or declines
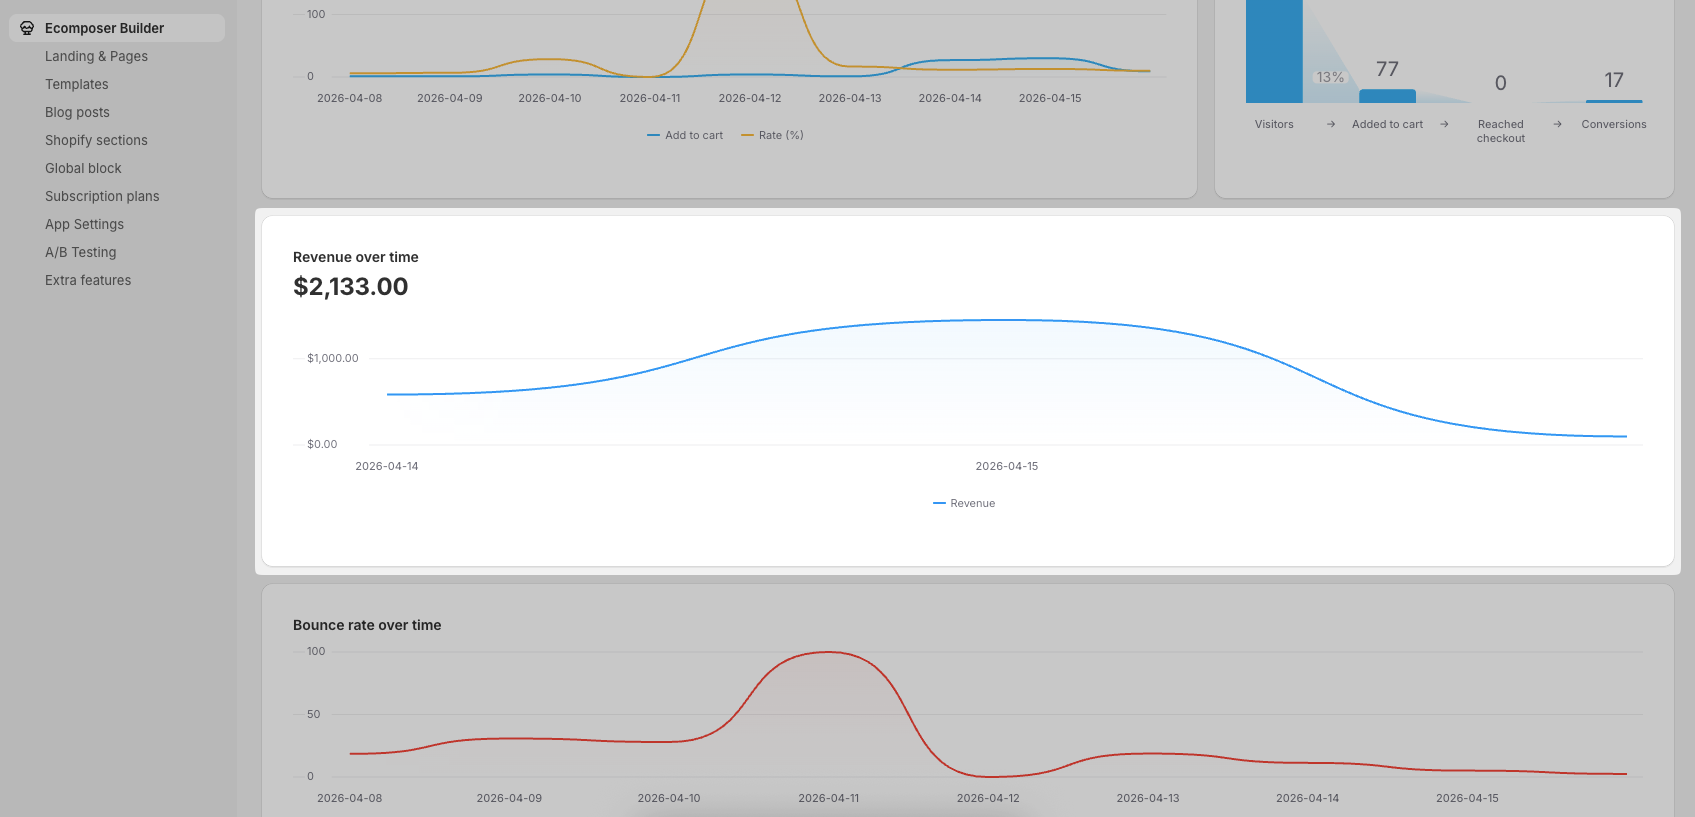
Conversion Rate Breakdown
- Visual funnel from Visitors → Added to cart → Reached checkout → Conversions
- Helps you understand where users drop off in the buying journey
- Useful for optimizing specific steps in the funnel
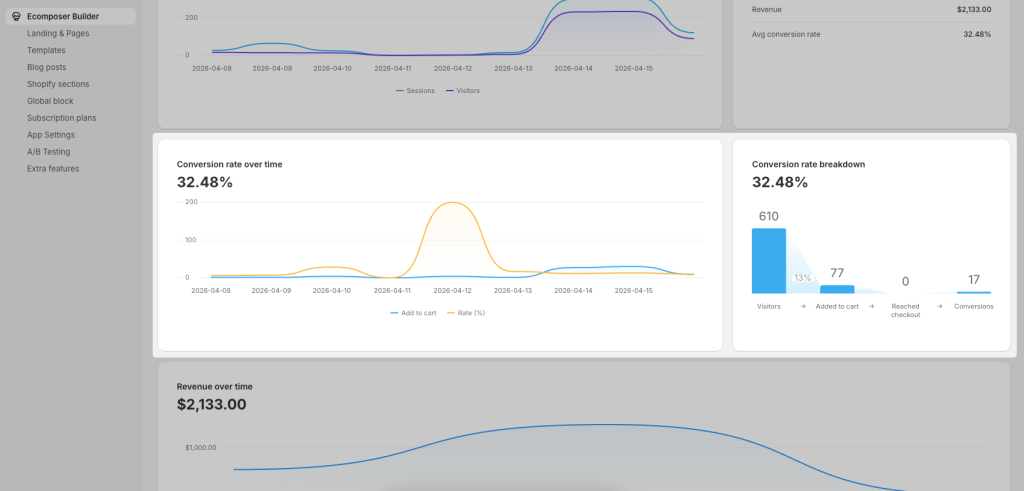
Revenue Over Time
- Displays total revenue trends across the selected period
- Helps evaluate the effectiveness of campaigns and page performance
- Allows you to correlate revenue with traffic and conversion changes
Bounce Rate Over Time
- Shows the percentage of users who leave without interacting
- A rising bounce rate may indicate issues with content, design, or load speed
- A lower bounce rate typically reflects better engagement
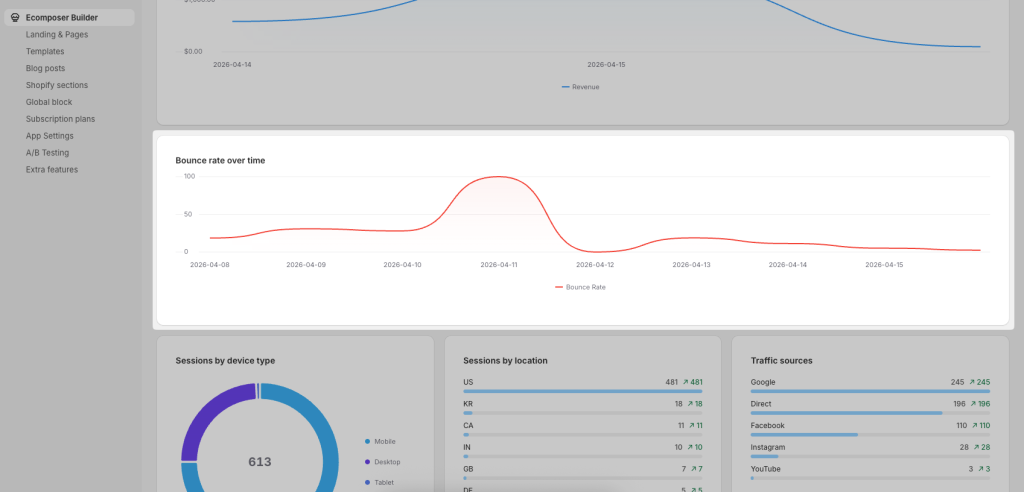
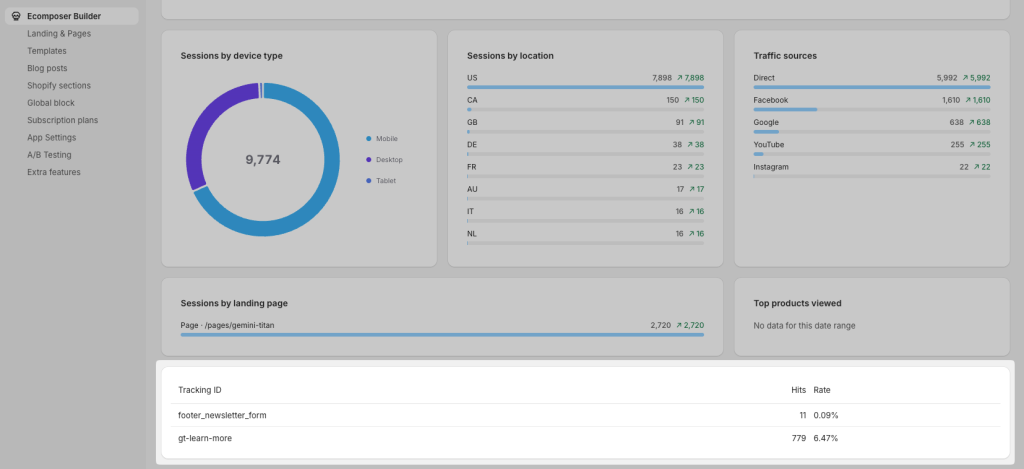
Audience Insights
- Sessions by Device Type
– Breaks down traffic by Mobile, Desktop, and Tablet
– Helps optimize your design for the most used devices - Sessions by Location
– Shows where your visitors are coming from (country-level data)
– Useful for targeting specific markets or regions - Traffic Sources
– Displays where your traffic originates from such as Direct, Facebook, Google, YouTube, Instagram
– Helps evaluate which channels drive the most visitors
– Useful for optimizing marketing efforts and ad spend
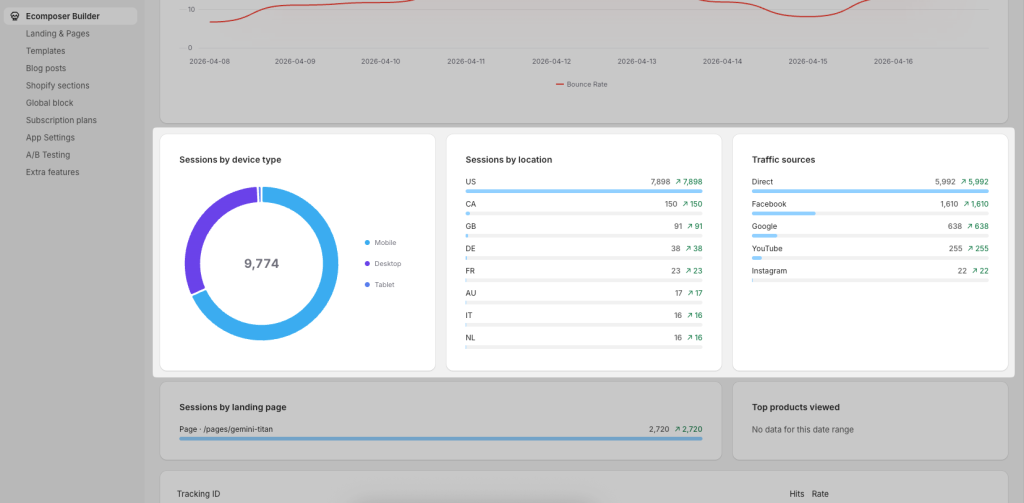
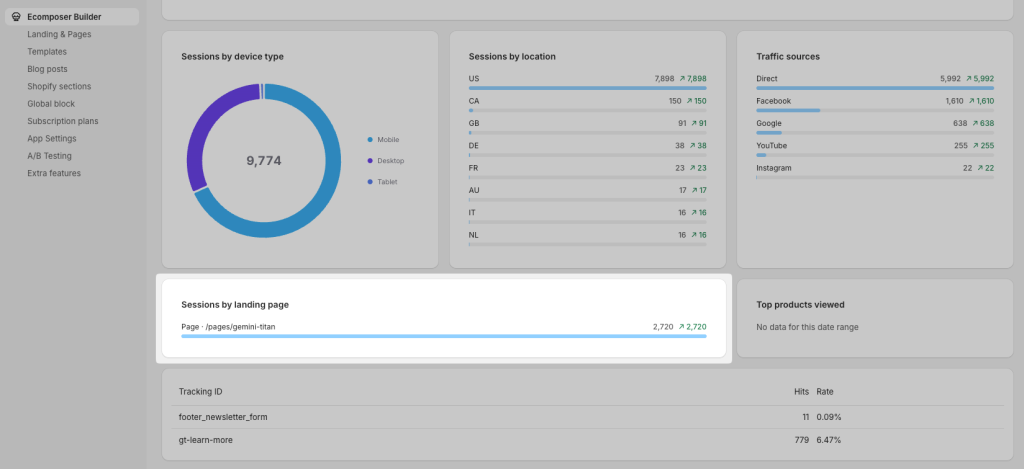
Sessions by Landing Page
- Shows which page users enter your store from
- Helps identify top-performing entry pages
- Useful for optimizing landing page content and campaigns
Top Products Viewed
- Displays the most viewed products during the selected period
- Helps identify customer interest and trending products
- If no data is available, this section will remain empty
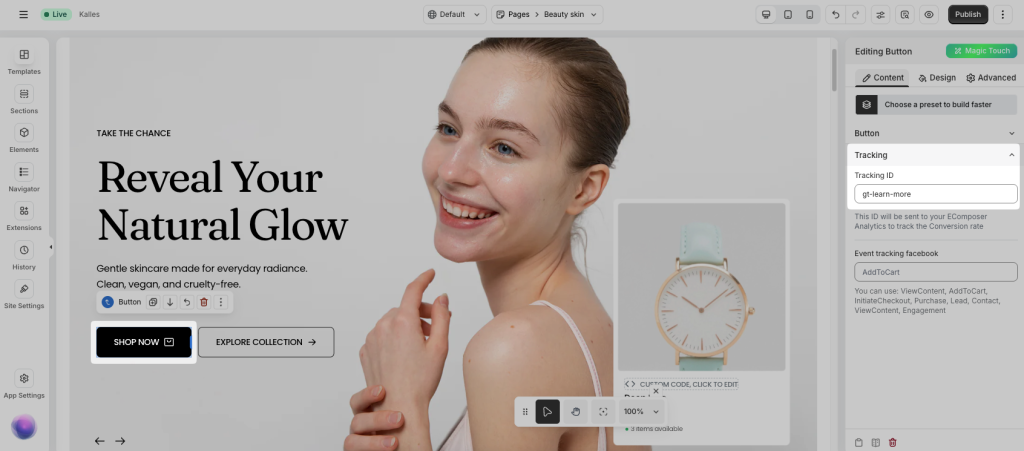
Tracking & Events
- Lists tracked elements such as buttons or forms (e.g. newsletter form, learn more button)
- Shows Hits and Conversion rate for each tracked item
- Helps measure the effectiveness of specific actions on your page
To track the conversion rate of a button on your page, from the EComposer editor, click on that button, navigate the button settings, and enter the Tracking ID here:
EComposer’s Page Analytics feature is an excellent tool for tracking the performance of your web pages. By analyzing key metrics like Sessions, Visitors, Add-to-Cart, Page Revenue, and Bounce Rate, you can gain valuable insights into user behavior and optimize your pages for better conversions. Whether you’re new to eCommerce or a seasoned pro, EComposer’s Page Analytics feature can help you take your website to the next level.


1 Comment
Midas
🎉 Wow! The new analytic features of EComposer are truly game-changing! 📊✨ Now, it’s easier than ever to track and understand user behavior and engagement on our pages. The detailed insights provided by these features allow us to make data-driven decisions, optimizing our site for maximum performance and user satisfaction. Kudos to the EComposer team for continually enhancing their platform to better serve their users! 🙌💯